 Menu
Menu
 Shanice Shallies
Brokered by Keller Williams Realty Las Vegas
Duplex Income, Equity & Upside ROI Analysis
2400 Pardee Place, Las Vegas, NV 89104
Contact meThe Investment Case
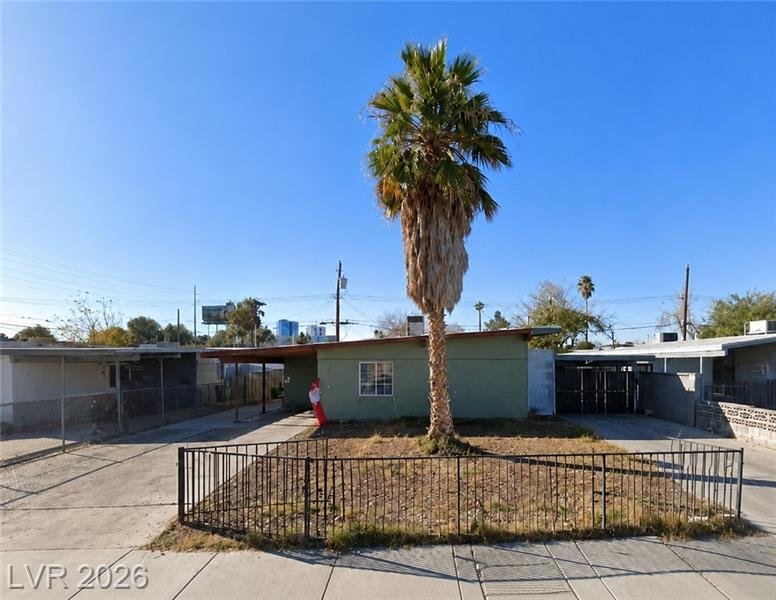
2400 Pardee Place presents an opportunity to acquire an occupied duplex with two existing income streams at an asking price of $385,000. Each residence has its own outdoor space, parking access, storage, and laundry facilities. The property's appeal is its established rental use and ability to generate income from two separate households.
The investment decision depends on how much of that rental income remains after the actual operating costs, capital reserves, and financing. The existing rent roll provides a useful starting point, but it should not be mistaken for the property's final investment return.
The seller reports annual operating income of $34,500 and operating expenses of $6,000, implying $28,500 annually before debt service if those figures are complete and accurately classified.
The actual leases, payment history, and itemized expenses must support that figure. Water, sewer, and pest control are listed as owner responsibilities. Vacancy, management, insurance, repairs, and capital reserves need to be accounted for in the investment scenarios rather than assuming the reported expense total covers everything.
Scenario Comparison
Current income uses the rents entered for this property. Other cases are labeled assumptions and can be changed as better information arrives.
| Measure | Current income Reported | Cautious case Assumption | All Cash Purchase Assumption |
|---|---|---|---|
| Scheduled annual income | $34,500 | $34,500 | $34,500 |
| After vacancy | $32,775 | $31,740 | $32,775 |
| Operating costs and reserves | $13,652 | $13,569 | $13,652 |
| Net operating income | $19,123 | $18,171 | $19,123 |
| Cap rate | 5.0% | 4.7% | 5.0% |
| Monthly principal and interest | $1,921 | $1,921 | $0 |
| Monthly cash flow | $-327 | $-407 | $1,594 |
| Cash invested | $122,800 | $122,800 | $411,550 |
| Annual cash on cash return | -3.2% | -4.0% | 4.6% |
| Debt coverage ratio | 0.83 | 0.79 | Pending verification |
| Break even occupancy | 107.4% | 107.4% | 34.8% |
What the Numbers Include
Current income
Reported- Purchase price
- 385000
- Down payment %
- 25
- Interest rate %
- 7
- Loan term in years
- 30
- Closing costs
- 11550
- Upfront repairs
- 5000
- Initial cash reserves
- 10000
- Monthly scheduled rent
- 2875
- Other monthly income
- 0
- Vacancy allowance %
- 5
- Annual taxes
- 1145
- Annual insurance
- 2400
- Monthly HOA or community fees
- 0
- Monthly owner utilities
- 250
- Monthly solar payment
- 0
- Other monthly costs
- 0
- Management % of collected income
- 8
- Maintenance % of scheduled income
- 8
- Capital reserve % of scheduled income
- 5
Use the current rent roll and documented costs.
Cautious case
Assumption- Purchase price
- 385000
- Down payment %
- 25
- Interest rate %
- 7
- Loan term in years
- 30
- Closing costs
- 11550
- Upfront repairs
- 5000
- Initial cash reserves
- 10000
- Monthly scheduled rent
- 2875
- Other monthly income
- 0
- Vacancy allowance %
- 8
- Annual taxes
- 1145
- Annual insurance
- 2400
- Monthly HOA or community fees
- 0
- Monthly owner utilities
- 250
- Monthly solar payment
- 0
- Other monthly costs
- 0
- Management % of collected income
- 8
- Maintenance % of scheduled income
- 8
- Capital reserve % of scheduled income
- 5
Illustrative allowances. Adjust to verified property history.
All Cash Purchase
Assumption- Purchase price
- 385000
- Down payment %
- 100
- Interest rate %
- Not supplied
- Loan term in years
- Not supplied
- Closing costs
- 11550
- Upfront repairs
- 5000
- Initial cash reserves
- 10000
- Monthly scheduled rent
- 2875
- Other monthly income
- 0
- Vacancy allowance %
- 5
- Annual taxes
- 1145
- Annual insurance
- 2400
- Monthly HOA or community fees
- 0
- Monthly owner utilities
- 250
- Monthly solar payment
- 0
- Other monthly costs
- 0
- Management % of collected income
- 8
- Maintenance % of scheduled income
- 8
- Capital reserve % of scheduled income
- 5
Illustrative allowances. Enter supportable rent and cost changes before publishing.
Strengths
Two occupied income producing residences.
Existing combined scheduled rent of $2,875 monthly.
Separate fenced outdoor areas, driveways or carports, storage, and laundry facilities.
No monthly HOA fee reported.
Potential flexibility for traditional investment ownership or future owner occupancy, subject to existing lease terms.
Tradeoffs
The property was constructed in 1954, making the condition of major systems especially important. The seller's $6,000 annual expense figure does not provide enough detail to establish a dependable operating budget.
The public remarks describe two 3 bedroom residences, while the MLS unit table identifies one 3 bedroom residence and one 2 bedroom residence. The discrepancy affects how the property should be evaluated and marketed.
The property is tenant occupied, and interior access is restricted. The listing photos were taken before current tenant occupancy.
Before Making a Decision
Obtain current leases, rent ledger, security deposit records, payment history, and confirmation of which expenses are paid by the owner.
Request an itemized operating statement, insurance information, utility bills, maintenance history, and any known major repairs.
Verify bedroom counts and unit configurations against permits and property records.
Inspect roofing, plumbing, electrical systems, HVAC, foundation, and individual unit interiors.
Confirm the condition of both residences and establish any immediate repair or capital improvement requirements.
Closing Read
2400 Pardee Place has a straightforward investment concept: two occupied residences producing a combined $34,500 in scheduled annual rent. The rent roll makes the income side understandable, while the reported expenses provide an initial reference rather than a verified final return.
At $385,000, the property deserves evaluation through both an all cash scenario and a financed purchase scenario. The deciding factor is the amount of dependable cash flow remaining after realistic expenses, reserves, and debt service.
Sources and Calculation Notes
MLS unit rents: $1,750 + $1,125 = $2,875 monthly per MLS unit table
MLS annual income: $34,500
MLS annual expenses: $6,000
MLS income less stated expenses: $28,500 (not a substitute for independently calculated scenario NOI)
The MLS reports $34,500 in annual operating income and $6,000 in annual operating expenses. The two reported rents reconcile to $34,500 annually.
The public remarks describe two 3 bedroom units, while the unit table identifies one 3 bedroom unit and one 2 bedroom unit. This needs verification.
The seller reports owner paid water, sewer, and pest control. The $6,000 expense total needs an itemized breakdown to establish which costs are included. The vacancy entry of 1.0 also needs clarification.
Gross yield uses scheduled rent divided by purchase price. Net operating income subtracts vacancy, operating costs, management, maintenance and reserves before debt payments. Cash on cash return divides annual cash flow after debt by the cash invested. These figures use the inputs shown above and should be checked against leases, actual expenses and financing terms.